Data warehouse
Bring sales, finance, stock and operational data into one place — usually BigQuery — with a scheduled refresh.
Sales has one figure, finance has another, and the Monday report takes half a day to assemble. We pull your data into one place, agree what each number means, and build dashboards that update themselves.
Capabilities
Bring sales, finance, stock and operational data into one place — usually BigQuery — with a scheduled refresh.
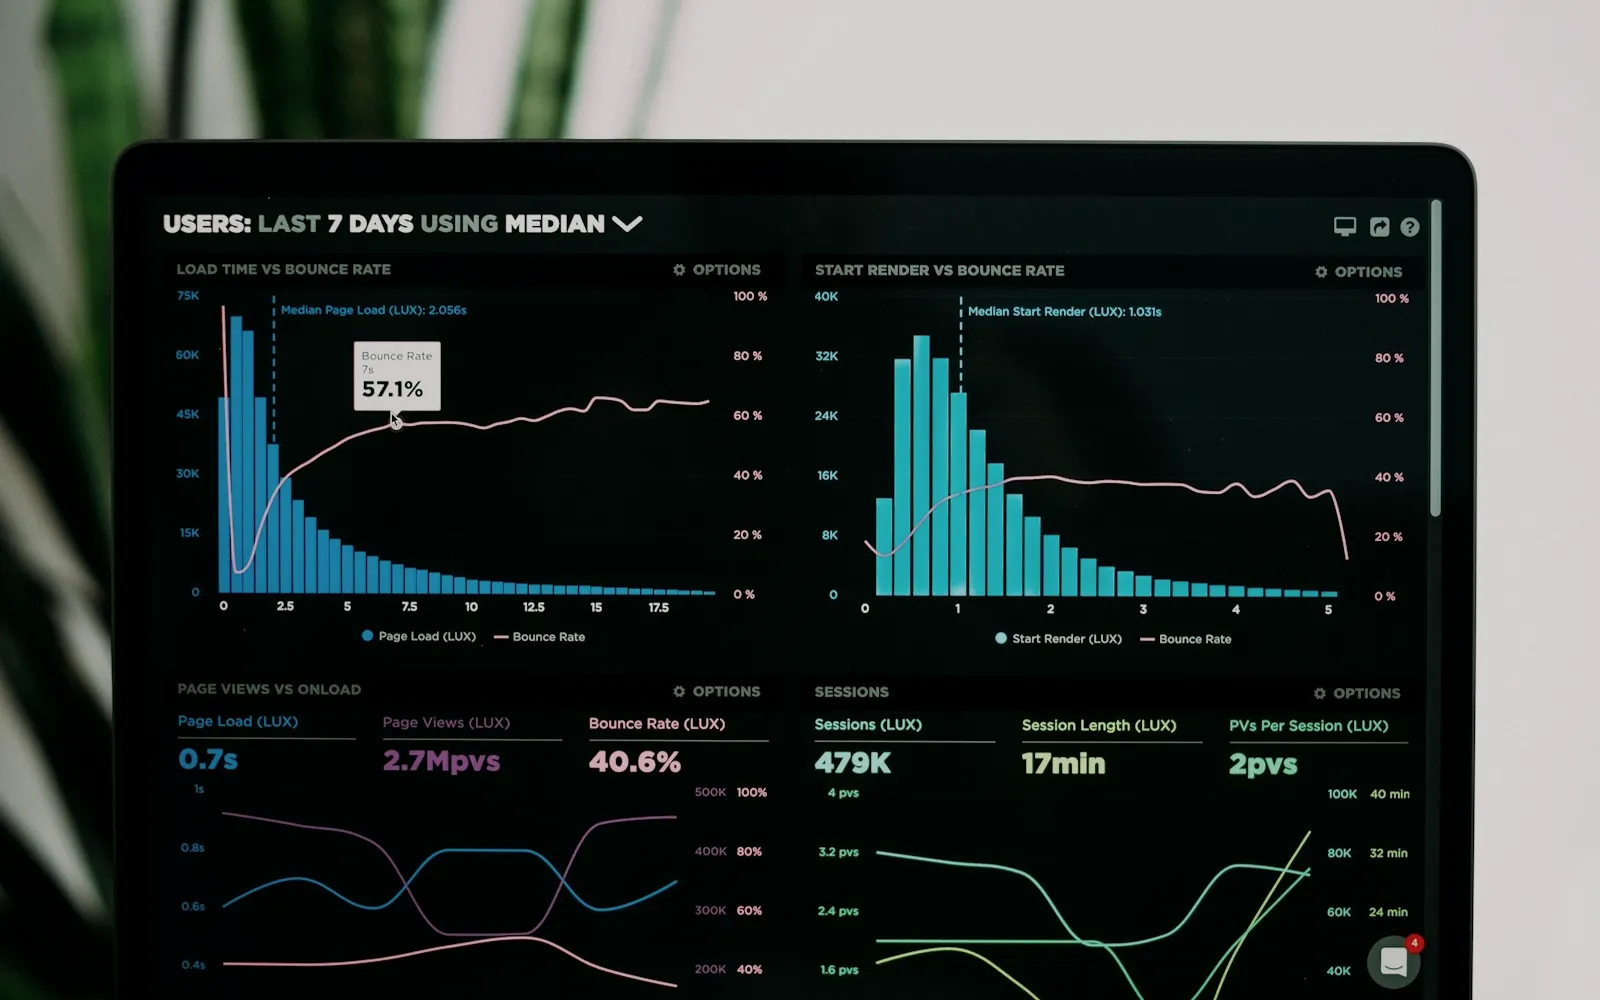
Looker or Power BI dashboards built around the decisions people actually make, not every metric available.
Pull from your databases, spreadsheets and SaaS tools automatically, and alert someone when a feed stops.
Write down what “revenue”, “active customer” and “margin” mean once, so every report uses the same figure.
Let people query the data in a sentence instead of waiting for someone to build a new report.
Demand, stock and revenue forecasts from your own history, with the uncertainty shown rather than hidden.
Deliverables
Built so your team can run and extend it without us. That is what a good handover looks like.
Chosen per project against what you already run and what your team knows — never out of habit.
Ways to start
Start small. A fixed-price first step gives both sides real information before anyone commits a build budget.
We map where your data lives, what state it is in and which reports are worth building first.
One area of the business — sales, stock or finance — brought together and live on real data.
Further sources and teams added, with monitoring on every pipeline.
For one or two sources, connecting directly is often fine and we will say so. Once you are joining several systems, or the reports slow your live database down, a warehouse is cheaper to run and far easier to trust.
It is normal. Part of the first week is finding out exactly how messy it is, and the fixes are built into the pipelines so the cleaning does not have to be repeated by hand.
If you already use Microsoft 365, Power BI usually fits best. If your data lives in Google Cloud, Looker does. We work in both and will recommend one based on what you already pay for.
For most small and mid-sized businesses the warehouse costs tens of pounds a month, plus dashboard licences. We show you the running cost before you commit.
Also relevant
Describe what you are trying to achieve. You will speak to someone who does this work every week, and get a straight answer on fit, cost and timing.
We reply to every enquiry within one working day.